
In today’s dynamic data environments, detecting and understanding data mutation patterns is critical for system reliability. In this blog post, we’ll explore how to use Debezium for comprehensive database activity logging and analysis in microservice architectures. We’ll delve into how Debezium captures row-level changes and streams them in real-time, enabling immediate visibility into database operations. By integrating with analytics tools, we’ll see how to build detailed activity dashboards that reveal the volume and nature of operations per table. These insights are invaluable for identifying unexpected patterns, such as a sudden drop in inserts caused by a new microservice deployment with a bug. You will learn how to set up Debezium, configure it for this specific use case, and utilize the generated data to create actionable dashboards.
The concept and the idea behind
In recent years, observability has become an essential part of modern systems due to the increasing complexity of architectures like microservices, containerized applications, and cloud environments.
Here are some important reasons why observability is crucial today:
- Faster Troubleshooting and Incident Response
-
Observability provides deep insights into system behavior, helping teams quickly identify and resolve issues by correlating logs, metrics, and traces, reducing downtime and improving response times.
- Proactive Issue Detection
-
Observability enables proactive monitoring by identifying anomalies and patterns in real-time, allowing teams to address potential problems before they impact users.
An application typically exposes different types of metrics to provide insights into its behavior, performance, and overall health. These metrics can be categorized into several key types:
- Infrastructure Metrics
-
These track the resource usage of the underlying infrastructure, such as: CPU Usage, Memory Usage, Disk I/O, Network I/O.
- Application Performance Metrics
-
These measure the application’s operational performance to ensure the application performs optimally and meets user expectations. For example: Request Rate, Error Rate, Latency, Throughput.
- Business Metrics
-
These focus on the application’s impact on business goals, such as: Number of Transactions, Conversion Rate, Revenue, User Signups.
Usually, infrastructure and application metrics are quite "standard," and there are frameworks/tools that can be easily used to instruct your application to expose those metrics. On the other hand, business metrics can vary between applications, so you need to implement custom code every time to expose those metrics.
The idea is to think at a lower level and leverage change data capture (CDC) to extract data that can be used as business metrics.
Suppose we have an order service that processes and stores orders made by our customers. An important business metric to monitor would be the number of orders made. This number is very relevant to the business because it directly correlates to the company’s earnings. A relevant drop in number of orders should alert the team responsible for that service as soon as possible.
Normally, we would need a counter metric that increments every time an order is correctly placed and stored in the database. But what if we could extract this information just by monitoring the database through CDC?
Let’s explore how Debezium offers this possibility.
How Debezium Exposes Metrics
Debezium exposes three categories of metrics:
- Snapshot metrics
-
Provide information about connector operation while performing a snapshot, such as RowsScanned, RemainingTableCount, TotalTableCount.
- Streaming metrics
-
Provide information about connector operation when the connector is reading the database log, such as TotalNumberOfCreateEventsSeen, QueueRemainingCapacity, QueueTotalCapacity.
- Schema history metrics
-
Provide information about the status of the connector’s schema history, such as ChangesApplied, ChangesRecovered, Status.
All these metrics are exposed through JMX. You can read more in our documentation.
Database Activity Metrics
Starting from the 3.0.0.Final release (specifically 3.0.0.Beta1), the following new streaming metrics were introduced:
- NumberOfCreateEventsSeen
-
Counts the number of create events per table.
- NumberOfDeleteEventsSeen
-
Counts the number of delete events per table.
- NumberOfUpdateEventsSeen
-
Counts the number of update events per table.
- NumberOfTruncateEventsSeen
-
Counts the number of truncate events per table.
Since these metrics are experimental, you need to opt-in to enable them by setting the internal.advanced.metrics.enable property to true.
Demo: Order service monitoring dashboard
After you expose these metrics with Debezium, you can easily create a dashboard with alerts to monitor any significant change that can influence your business. We’ll set up our order service with its own PostgreSQL database, Debezium PostgreSQL connector on the Kafka Connect runtime and Prometheus and Grafana as our observability platform.
For this demo you need to clone the code in the Debezium examples repository and go to the db-activity-monitoring directory.
Components overview
Order service
The order service is a Quarkus application that, per default, stores 100 orders every 10 seconds, or a rate of ~10 orders per second. You can simulate a bad deployment by setting the app.version property in application.properties to anything other than 1.0. This will force the application to perform order inserts at half the standard rate.
The application also exposes the application.info metric with a constant value of 1.0 but with two labels: version and name. We will use this metric to put a label on the graph to indicate the version of the deployed service.
JMX exporter configuration
We saw that Debezium exposes metrics as a JMX bean so normally to expose those metrics to Prometheus we can use the JMX exporter. In the debezium-jmx-exporter the config.yml file contain its configuration. The most important the following pattern
- pattern: "debezium.([^:]+)<type=connector-metrics, context=([^,]+), server=([^,]+), key=([^>]+)><>NumberOfCreateEventsSeen"
  name: "debezium_metrics_create_events_count"
  labels:
    plugin: "$1"
    context: "$2"
    name: "$3"
    table: "$4"
  type: "COUNTER"
Given that the name of the MBean is debezium.postgres<type=connector-metrics, context=streaming, server=monitoring, key=inventory.orders><>NumberOfCreateEventsSeen, the rule above simply creates the following metric:
# TYPE debezium_metrics_create_events_count_total counter
debezium_metrics_create_events_count{context="streaming",name="monitoring",plugin="postgres",table="inventory.orders",} 100.0
Components start up
After that you are ready to start the demo with the following steps:
-
Build our order service.
order-service/mvnw package -f order-service/pom.xml -
Run our compose file to start everything is needed.
export DEBEZIUM_VERSION=3.0.0.Final docker-compose up -d --build -
When all service are up and running we can register our connector
curl -i -X POST -H "Accept:application/json" -H "Content-Type:application/json" http://localhost:8083/connectors/ -d @postgres-activity-monitoring.json
Accessing the dashboard
Open a web browser and go to the Grafana UI at http://localhost:3000. Login into the console as user admin with password admin. When asked either change the password or skip this step.
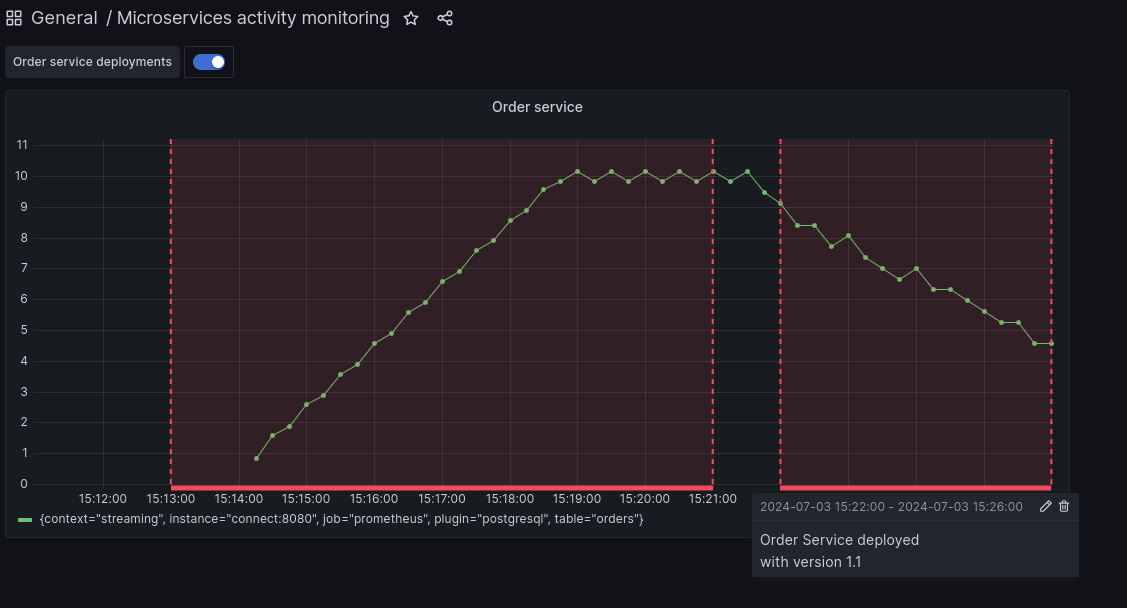
Then, to monitor the order service activity, we have created the General/ Microservices activity monitoring dashboard.
After a couple of minutes you should see that the order rate will be ~10 per second.
To simulate a drop, we can just update the APP_VERSION env to a value different to 1.0.
docker stop order-service
docker rm -f order-service && \
docker compose run -d -e APP_VERSION=1.1 --name order-service order-service
After a while you will see that the service will start creating orders with a ~50% drop (see Figure 1).
Since we have also configured an alert to fire when the order rate is below 7, you can also check that it is firing in the alert panel.
But that’s not all, we have also configured a mail notification that you can check accessing the Fake SMTP UI at http://localhost:8085.
Conclusion
We have seen how Change Data Capture (CDC) can extract insights from the database to serve as key performance indicators (KPIs) in the reliability and observability of microservices. This approach allows us to avoid modifying our service to expose these metrics and instead rely on Debezium for data collection.
While not all business metrics can be derived from database operations, a significant portion can be.
Any comments, suggestions, or questions are welcome, so please feel free to reach out to me to discuss further.
Fiore Mario Vitale
Active in the open-source community with contributions to various projects, Mario is deeply involved in developing Debezium, the distributed platform for change data capture. During his career he developed extensive experience in event-driven architectures heavily influenced by data. Throughout his career, Mario has predominantly focused on data-intensive software and product development, which has heightened his sensitivity to developer experience and data-driven applications. Beyond his professional pursuits, Mario finds his sweet spot where tech and his personal interests come together. He loves taking photos, especially when he manages to freeze a beautiful moment. He's also passionate about motorsports and racing. When he's not coding, you can often find him exploring the great outdoors on his mountain bike, fueling his passion for adventure.
About Debezium
Debezium is an open source distributed platform that turns your existing databases into event streams, so applications can see and respond almost instantly to each committed row-level change in the databases. Debezium is built on top of Kafka and provides Kafka Connect compatible connectors that monitor specific database management systems. Debezium records the history of data changes in Kafka logs, so your application can be stopped and restarted at any time and can easily consume all of the events it missed while it was not running, ensuring that all events are processed correctly and completely. Debezium is open source under the Apache License, Version 2.0.
Get involved
We hope you find Debezium interesting and useful, and want to give it a try. Follow us on Twitter @debezium, chat with us on Zulip, or join our mailing list to talk with the community. All of the code is open source on GitHub, so build the code locally and help us improve ours existing connectors and add even more connectors. If you find problems or have ideas how we can improve Debezium, please let us know or log an issue.