
It’s useful from time to time to evaluate the performance of an entire project - or at least selected parts of it. This is especially important when adding new features or performing major code refactoring. However, performance checks can also be done ad hoc, or ideally, on a regular basis.
In this blog post, I’d like to demonstrate a quick way to identify and analyze a particular type of performance issue in Debezium. The post walks through the full cycle: setting up a lightweight performance test, analyzing the results, proposing an improvement, and evaluating its impact.
Setting up proper performance tests is often a challenging task with many nuances that can distort the results. The approach I describe here is meant to be a quick way to uncover potential bottlenecks - typically "low-hanging fruit" that are visible even with a simple test setup. That said, this doesn’t mean regular performance testing isn’t necessary. On the contrary - comprehensive and recurring tests, particularly end-to-end ones using advanced load generators, are essential. Many performance issues can only be detected in such complex environments.
Test setup
Debezium application
Let’s begin by creating a simple application based on the Debezium embedded engine and the PostgreSQL connector. The application uses a very basic configuration and mostly relies on default settings. Among other things, this means it uses the decoderbufs plugin to retrieve data from the PostgreSQL database. The application itself doesn’t process the obtained data - it deliberately avoids any record post-processing (such as single message transformations). This ensures that the application doesn’t spend most of its time outside the core data-fetching path. In other words, our focus here is on the efficiency of retrieving data from PostgreSQL using the decoderbufs plugin, and on identifying any potential hotspots in that path.
public class DebeziumEngniePostgres {
    public static void main(String[] args) {
        final Properties props = new Properties();
        props.setProperty("name", "engine");
        props.setProperty("connector.class", "io.debezium.connector.postgresql.PostgresConnector");
        props.setProperty("database.hostname", "127.0.0.1");
        props.setProperty("database.port", "5432");
        props.setProperty("database.user", "postgres");
        props.setProperty("database.password", "postgres");
        props.setProperty("database.dbname", "postgres");
        props.setProperty("topic.prefix", "perf");
        props.setProperty("table.include.list", "public.pgbench_.*");
        props.setProperty("snapshot.mode", "no_data");
        props.setProperty("offset.storage", "org.apache.kafka.connect.storage.FileOffsetBackingStore");
        props.setProperty("offset.storage.file.filename", "./data/offsets.dat");
        props.setProperty("offset.flush.interval.ms", "60000");
        props.setProperty("schema.history.internal", "io.debezium.storage.file.history.FileSchemaHistory");
        props.setProperty("schema.history.internal.file.filename", "./data/schemahistory.dat");

        try (DebeziumEngine<ChangeEvent<SourceRecord, SourceRecord>> engine = DebeziumEngine.create(Connect.class)
                .using(props)
                .notifying(record -> {
                }).build()
        ) {
            ExecutorService executor = Executors.newSingleThreadExecutor();
            executor.execute(engine);
            System.out.println("Debezium started");
            Thread.sleep(600000);
        }
        catch (IOException|InterruptedException e) {
            System.out.println("Failed with " + e);
        }
        System.out.println("Debezium stopped");
    }
}| The whole source code can be found in this GitHub repo. |
You can build and run the application using Maven as usual. You just need to create data directory first as Debezium engine will try to store the the offset and schema history files there.
Postgres
Since we’ve selected the PostgreSQL connector for this example, we’ll need to set up a test PostgreSQL database. To make this easy, we can use the container image provided by the Debezium project - it comes with all the necessary database configuration out of the box:
podman run --rm --name postgres -it -e POSTGRES_PASSWORD=postgres -p 5432:5432 quay.io/debezium/example-postgres:3.2Next, we need a tool to generate some load on the database during testing. PostgreSQL includes such a tool: pgbench. On most Linux distributions, it’s shipped separately from the core database package. For example, on Fedora, you’ll need to install the postgresql-contrib package.
| One of the key aspects of setting up regular performance tests is choosing a proper load generator. Tools like |
Before using pgbench, we need to initialize the test tables it will operate on:
PGPASSWORD=postgres pgbench -h 127.0.0.1 -U postgres -i postgres --scale=10This command creates a few pgbench_* tables in the database. As you may have noticed, our application is already configured to capture changes from these pgbench_* tables.
Running the test
Now that everything is ready, let’s generate some load on the database using pgbench:
PGPASSWORD=postgres pgbench -h 127.0.0.1 -U postgres --scale=10 -b simple-update --jobs=20 --client=20 -T 120 postgresAt the same time, we’ll run out test application with Java Flight Recorder enabled:
java -XX:+FlightRecorder -XX:StartFlightRecording=delay=30s,duration=60s,filename=dbz-flight.jfr,settings=profile -jar dbz-app/target/debezium-quick-perf-1.0-SNAPSHOT.jarTo capture Flight Recorder events, make sure to include the -XX:+FlightRecorder option when starting the application. You can start the recording manually via your profiling tool, or configure it via command-line options to define the delay, duration, output file, and profiling settings: -XX:StartFlightRecording=delay=30s,duration=60s,filename=dbz-flight.jfr,settings=profile.
Once the recording is complete, you can stop both the application and pgbench (if it’s still running). You may also stop the database container and remove it.
If you want to repeat the test, it’s a good idea to start with a clean database and delete the offset file in the data directory to reset the connector’s position.
Analyzing the results
Once we have the Flight Recorder file, we can open it in any tool that supports Java Flight Recorder (JFR). This might be your IDE, but I prefer to use a dedicated tool: Java Mission Control (JMC).
However, one known limitation of JMC is its poor support for Wayland. As a result, some views, like the flame graph, which we need, might appear empty. For more details, see JMC-8247.
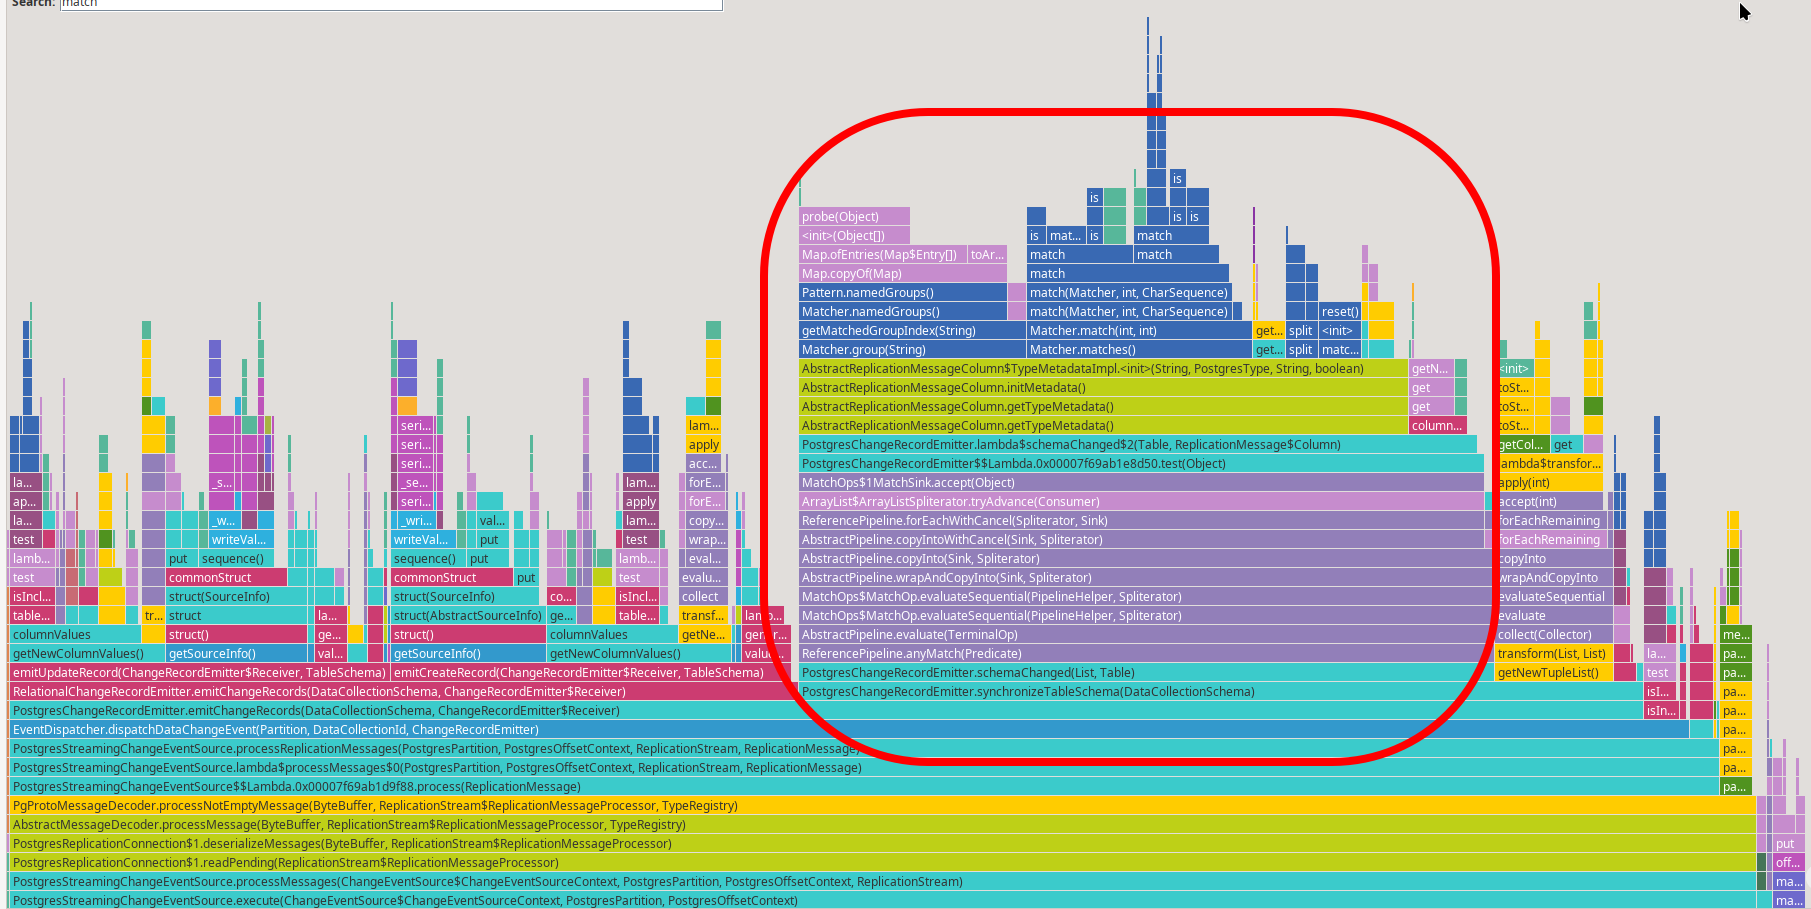
The flame graph provides a quick overview of where the application is spending its time:
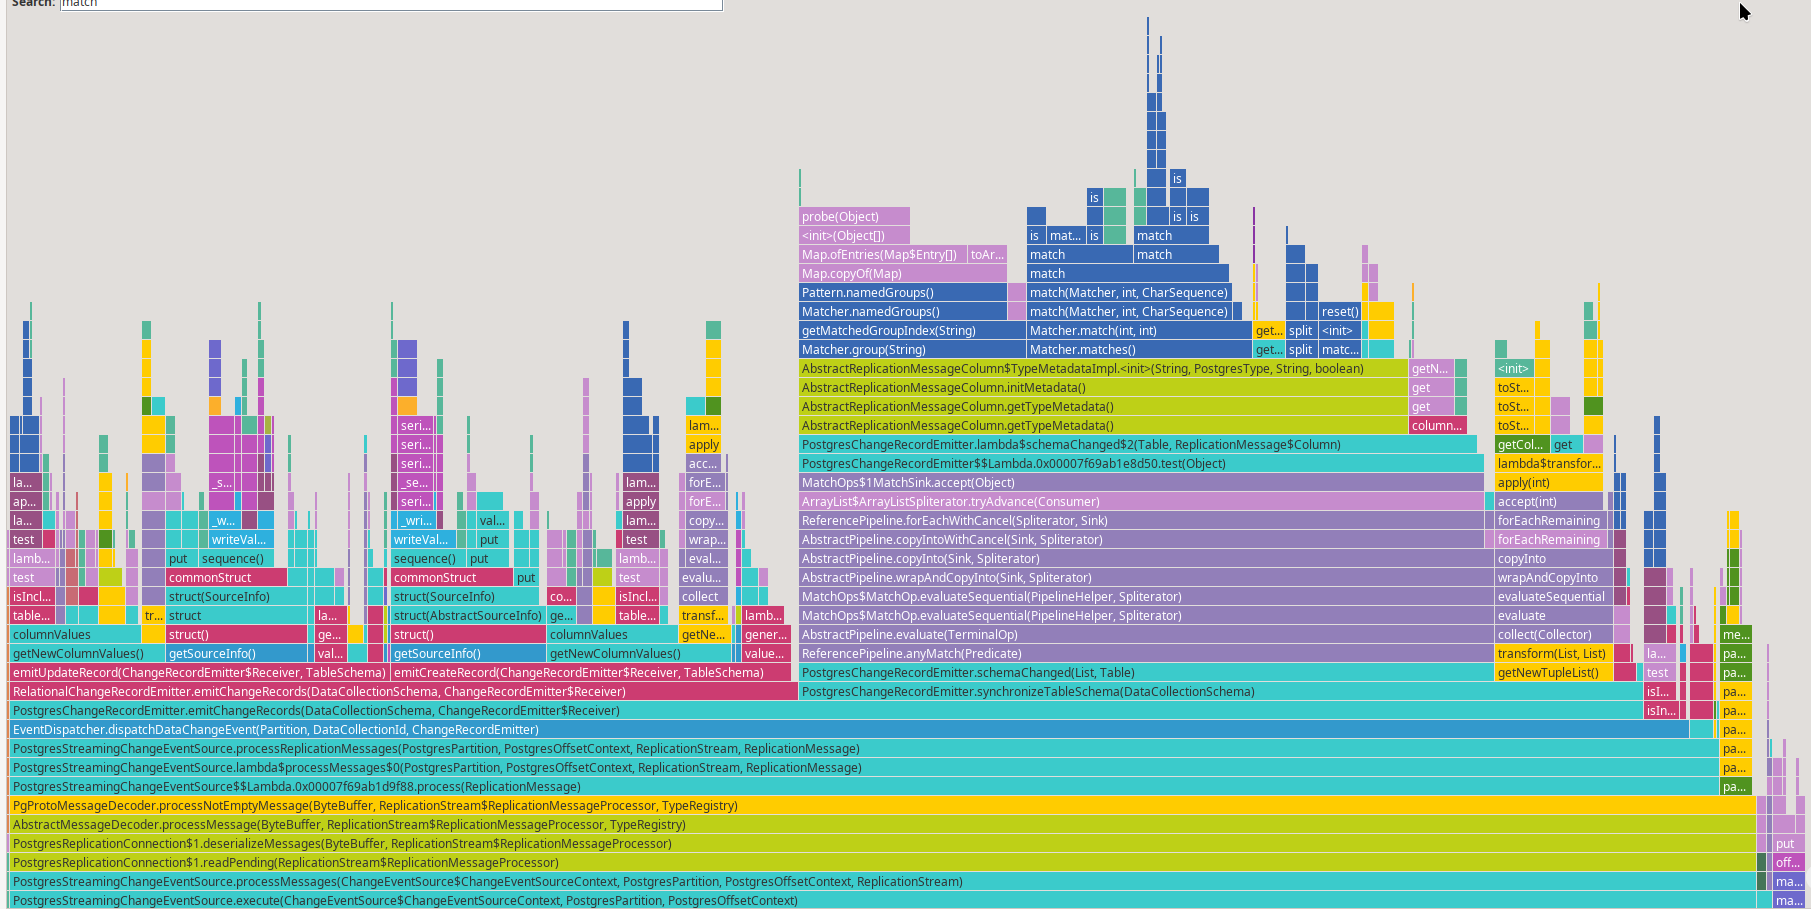
One thing that immediately stands out is the significant time spent in the schemaChanged() method, especially in regular expression matching:
The same issue is evident in the Method Profiling view:
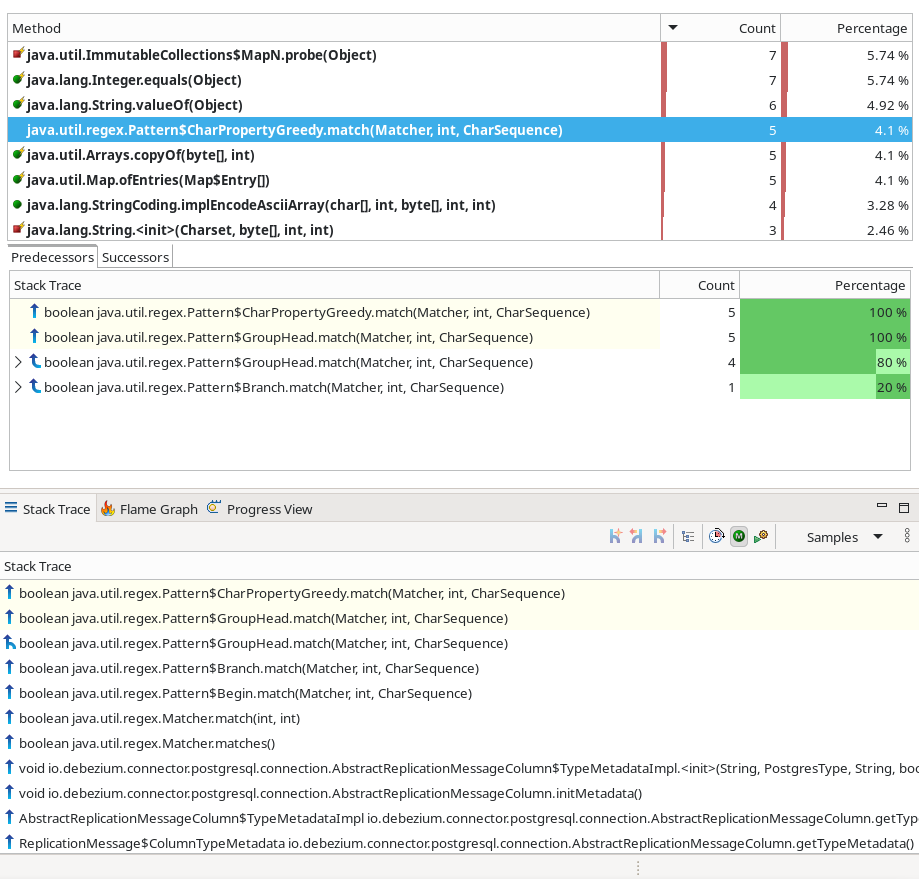
Here, regular expression matching is one of the hottest methods. You can also inspect the stack trace of sampled events to see exactly where this computation originates.
The root of the problem is that PostgreSQL doesn’t emit dedicated schema change events. Instead, schema metadata is embedded in the first record that uses the updated schema. As a result, Debezium must check for possible schema changes in almost every record it processes. The actual implementation depends on the plugin in use. With the default decoderbufs plugin, Debezium compares the record’s type and other modifiers against the info Debezium already has. These type modifiers are provided as String and parsed using regular expressions - per record. Over time, this adds up.
Since we’ve identified a potential bottleneck, it’s a good idea to report our findings to the development team. For this particular issue, I filed DBZ-9093.
Proposing fix
In the previous step, we identified a performance issue in the PostgreSQL connector when using the decoderbufs plugin. Fortunately, this problem doesn’t exist when using the pgoutput plugin. However, since decoderbufs is still supported, and even set as the default, let’s explore how we might fix it.
JMH benchmark
To measure the impact of our fix, we can use the Java Microbenchmark Harness (JMH), a tool specifically designed for this purpose. Very simple JMH benchmark can look like this:
@State(Scope.Benchmark)
public class PostgresTypeMetadataPerf {

    private static final int OP_COUNT = 10;
    private static final int MOD_COUNT = 10;
    private static final String[] MODIFIERS = {
            "text",
            "character varying(255)",
            "numeric(12,3)",
            "geometry(MultiPolygon,4326)",
            "timestamp (12) with time zone",
            "int[]",
            "myschema.geometry",
            "float[10]",
            "date",
            "bytea"
    };

    private ReplicationMessage.Column[] columns = new ReplicationMessage.Column[OP_COUNT];

    private ReplicationMessage.Column createColumn (int modifierIndex) {
        String columnName = "test";
        PostgresType columnType = PostgresType.UNKNOWN;
        String typeWithModifiers = MODIFIERS[modifierIndex];
        boolean optional = true;
        return new AbstractReplicationMessageColumn(columnName, columnType, typeWithModifiers, optional) {
            @Override
            public Object getValue(PostgresStreamingChangeEventSource.PgConnectionSupplier connection,
                    boolean includeUnknownDatatypes) {
                return null;
            }
        };
    }

    @Setup(Level.Invocation)
    public void setup() {
        Random random = new Random(1234);
        for (int i = 0; i < OP_COUNT; i++) {
            columns[i] = createColumn(random.nextInt(MOD_COUNT));
        }
    }

    @Benchmark
    @BenchmarkMode(Mode.AverageTime)
    @OutputTimeUnit(TimeUnit.MICROSECONDS)
    @Fork(value = 1)
    @OperationsPerInvocation(OP_COUNT)
    public void columnMetadata(Blackhole bh) {
        for (int i = 0; i < OP_COUNT; i++) {
            bh.consume(columns[i].getTypeMetadata());
        }
    }
}
While JMH and microbenchmarking in general come with many caveats to write it correctly, this benchmark at least provides us some baseline.
Here are the results from my machine, using the unpatched code:
Iteration   1: 0.768 us/op
Iteration   2: 0.761 us/op
Iteration   3: 0.780 us/op
Iteration   4: 0.780 us/op
Iteration   5: 0.750 us/op

Benchmark                                Mode  Cnt  Score   Error  Units
PostgresTypeMetadataPerf.columnMetadata  avgt    5  0.768 ? 0.049  us/op
Given that type modifiers are typically reused, a straightforward optimization is to cache parsed modifiers in a map. After implementing this caching logic, the JMH benchmark gave me the following results:
Iteration   1: 0.278 us/op
Iteration   2: 0.278 us/op
Iteration   3: 0.284 us/op
Iteration   4: 0.288 us/op
Iteration   5: 0.291 us/op

Benchmark                                Mode  Cnt  Score   Error  Units
PostgresTypeMetadataPerf.columnMetadata  avgt    5  0.284 ? 0.023  us/op
While this is a simple benchmark, and there may be some issues, the improvement is significant enough to suggest real-world benefit.
Verification in Our Test App
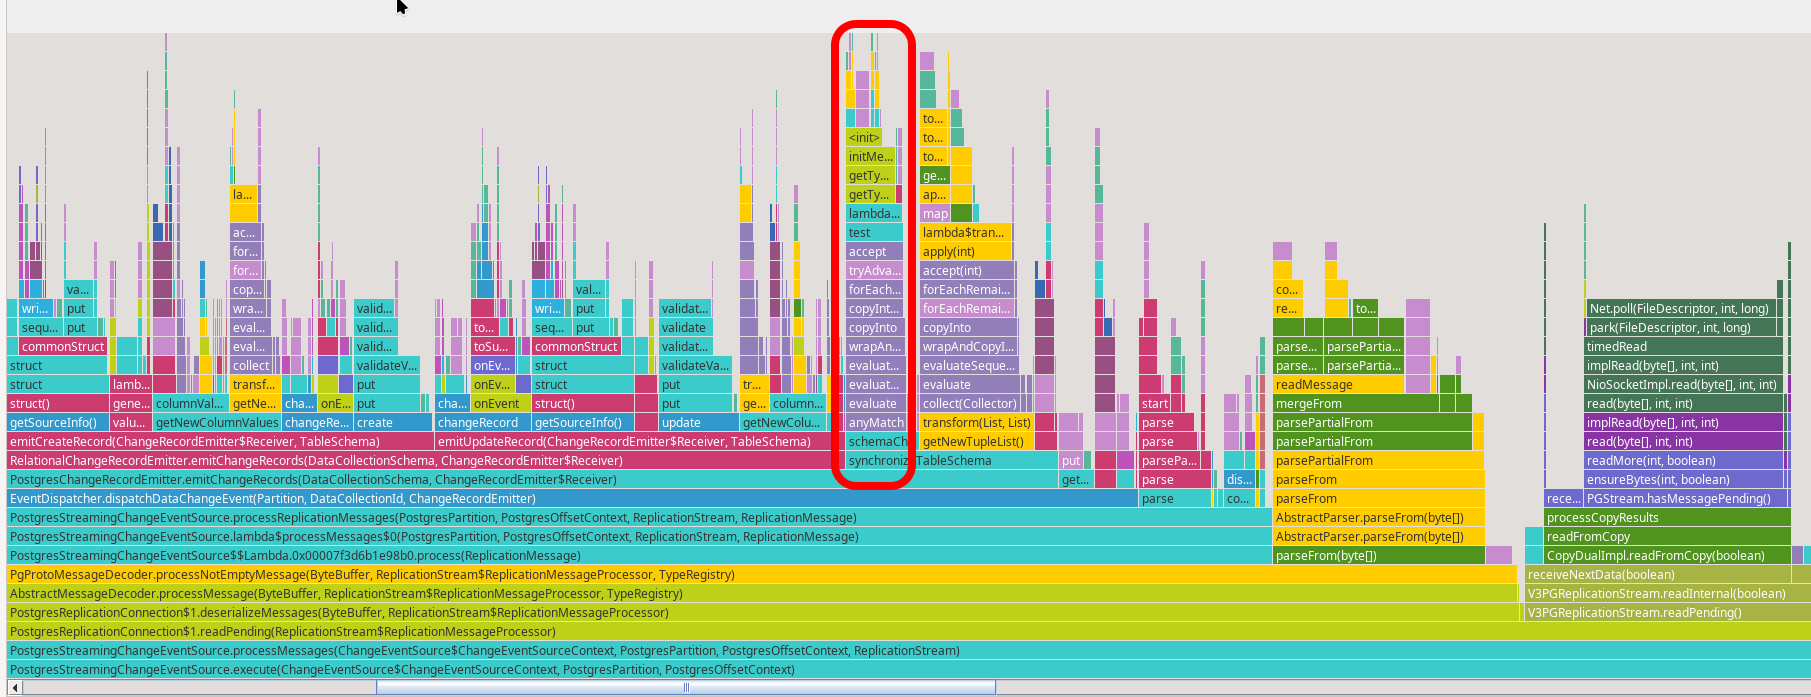
As a final test, we can re-run our simple performance test and check how much time is still spent in schemaChanged(). A quick look at the updated flame graph shows a clear improvement:
Once you’re confident with the fix, you can submit a pull request - ideally including the JMH benchmark you used for validation.
To gain high confidence in the effectiveness of this fix, a full end-to-end performance test pipeline would be necessary. However, the actual impact in such a complex environment might be minor or even negligible. Unlike our controlled test or JMH benchmark, a real-world scenario includes serialization, I/O overhead, and many other factors that may diminish the visible gain. What looks like a major win in isolation might translate to only a small improvement overall - but every bit helps.
Conclusion
In this post, we explored a lightweight approach to identifying performance bottlenecks in Debezium, using the embedded engine with the PostgreSQL connector. By leveraging a simple test setup, Flight Recorder, and flame graph analysis, we were able to pinpoint a costly inefficiency in regular expression processing within the decoderbufs plugin.
Although the setup intentionally simplifies many aspects of real-world scenarios and comes with other potential pitfalls, it still proves useful for catching low-hanging performance issues. It enables developers to run lightweight benchmarks directly on their machines, helping to uncover and address inefficiencies early in the development process. These optimizations can improve overall throughput and reduce unnecessary CPU usage, especially in high-throughput environments. While this approach can’t replace comprehensive, end-to-end performance testing, it offers a fast and pragmatic way to uncover and address performance regressions or inefficiencies during development. It’s also a great first step before investing time into a more complex benchmarking pipeline.
If you’ve encountered similar patterns or have ideas on improving the performance of Debezium or CDC pipelines in general, feel free to share your thoughts - or better yet, contribute a patch!
About Debezium
Debezium is an open source distributed platform that turns your existing databases into event streams, so applications can see and respond almost instantly to each committed row-level change in the databases. Debezium is built on top of Kafka and provides Kafka Connect compatible connectors that monitor specific database management systems. Debezium records the history of data changes in Kafka logs, so your application can be stopped and restarted at any time and can easily consume all of the events it missed while it was not running, ensuring that all events are processed correctly and completely. Debezium is open source under the Apache License, Version 2.0.
Get involved
We hope you find Debezium interesting and useful, and want to give it a try. Follow us on Twitter @debezium, chat with us on Zulip, or join our mailing list to talk with the community. All of the code is open source on GitHub, so build the code locally and help us improve ours existing connectors and add even more connectors. If you find problems or have ideas how we can improve Debezium, please let us know or log an issue.