The current pattern in application development gravitates toward microservices and microservices architecture. While this approach gives the developer teams great flexibility in terms of independent deployments and development velocity, the drawback is at hand when you try to track a bug in production.
Monolithic applications sit nicely at a single place so you can introspect the code flows and the application’s runtime state. This is more challenging with microservice architectures, as a single business transaction can span across tens of services deployed in separate processes and compute nodes.
You can rely on traditional methods like logging where you need to collect and correlate logs at a single place, so you can try to reconstruct the business transaction path. This is one of the tools in the box we can use, but it still can be crude and it will not provide all the necessary context. Distributed Tracing comes here to the rescue.
Distributed Tracing
Distributed tracing allows services to leave breadcrumbs during the execution with enough information to create an execution path of the business transaction enriched with contextual data like "who", "what", and "where". SRE teams and developers can then use it to browse through the recorded executions and check for errors or anomalies in execution that can signify either problems with deployments (services unavailabe) or even bugs.
And this is where Debezium becomes part of the picture. Data change events, as captured by Debezium from a database, and propagated via Kafka Connect and Apache Kafka to one more more downstream consumers are part of a data flow which is very valuable to have insight into. How long does it take for change events to flow from source database to sink systems? Where is the most time spent in the pipeline? Are there any anomalies like spikes in end-to-end lags? The integration of distributed tracing with Debezium can help to answer these questions.
OpenTracing
There are multiple solutions for distributed tracing, but as a starting point we have decided to follow and use the OpenTracing specification. OpenTracing is an incubating project of Cloud Native Computing Foundation which guarantees that the user will be free of any vendor lock-in by adhering to an open standard.
| The OpenTracing project is in the process of being merged with OpenCensus to the improved OpenTelemetry standard. Debezium uses OpenTracing at this point for alignment reasons with other projects (e.g. Quarkus), but it will use and support OpenTelemetry in the future, too. |
A distributed trace in OpenTracing consists of a set of spans. Each span represents a logical unit of work executed. The spans can form a tree when a larger part of the business transaction represented by one span can be compounded of multiple tasks represented by additional spans that have a parent-child relationship to the main span.
OpenTracing is only the specification and the instrumentation API. To use it you need to have an implementation, too. While Debezium could be used any OpenTracing client implementation, our examples and documentation are based on the Jaeger distributed tracing platform.
Jaeger consists of multiple components responsible for data collection and storage as well as a graphical user interface in form of a web application. The Jaeger All-In-One container image will be used to simplify the deployment.
Debezium and OpenTracing
The Debezium integration with OpenTracing consists of three distinct components:
-
ActivateTracingSpanSMT -
EventDispatcherin the Debezium outbox extension for Quarkus applications -
EventRouterSMT
The first one is intended for general use. The latter two must be used hand-in-hand when a (Quarkus-based) service using the outbox pattern should be traced.
Outbox Distributed Tracing
The biggest problem with tracing integration is keeping the trace across process boundaries so that all the related spans are recorded in the same trace to enable end-to-end tracing. The OpenTracing specification provides a way how to export and import trace related metadata so the trace can be passed among different processes.
In the outbox extension we use this approach to export the metadata into a specific column in the outbox table, so that then the event router SMT can import them and resume the trace. In each of the steps executed one or more spans are created:
-
When an event arrives at
EventDispatchera new spanoutbox-writeis created. It is created as a child of a current active span (e.g. started by the invocation of an REST API of the current application), or as a root span if no parent span is available. -
The span metadata is exported into a distinct field of the outbox event.
-
The outbox event is written to the outbox table.
-
The Event Router SMT receives the event and imports the span metadata from the field
-
Two new spans are created
-
db-log-writewith its start timestamp set to database write timestamp. The fields from thesourceblock are added to the span as tags. -
debezium-readwith its start time set to the processing timestamp. Fields from the envelope are added to the span as tags.
-
-
Optionally, if OpenTracing integration is enabled at the Kafka producer level, a new span is created by the Kafka producer representing the write of the message to a Kafka topic with relevant metadata.
Demo
The outbox example was extended with distributed tracing support to demonstrate the functionality. This example contains two rudimentary microservices: an order service which exposes a REST API for placing purchase orders, and a shipment service which is notified by the order service about new purchase orders using the outbox pattern.
| This demo uses the Strimzi container image for Kafka Connect, as it already contains baked-in integration of OpenTracing at Kafka producer level. |
To try it yourself you need to:
-
check out the repository and switch to the
outboxdirectory -
build the services
$ mvn clean install
-
deploy the application
export DEBEZIUM_VERSION=1.4
docker-compose up --build
-
register a Debezium connector to listen on the outbox table
$ http PUT http://localhost:8083/connectors/outbox-connector/config < register-postgres.json
HTTP/1.1 201 Created
-
execute multiple business requests
$ http POST http://localhost:8080/orders < resources/data/create-order-request.json
$ http PUT http://localhost:8080/orders/1/lines/2 < resources/data/cancel-order-line-request.json
-
check the Jaeger UI
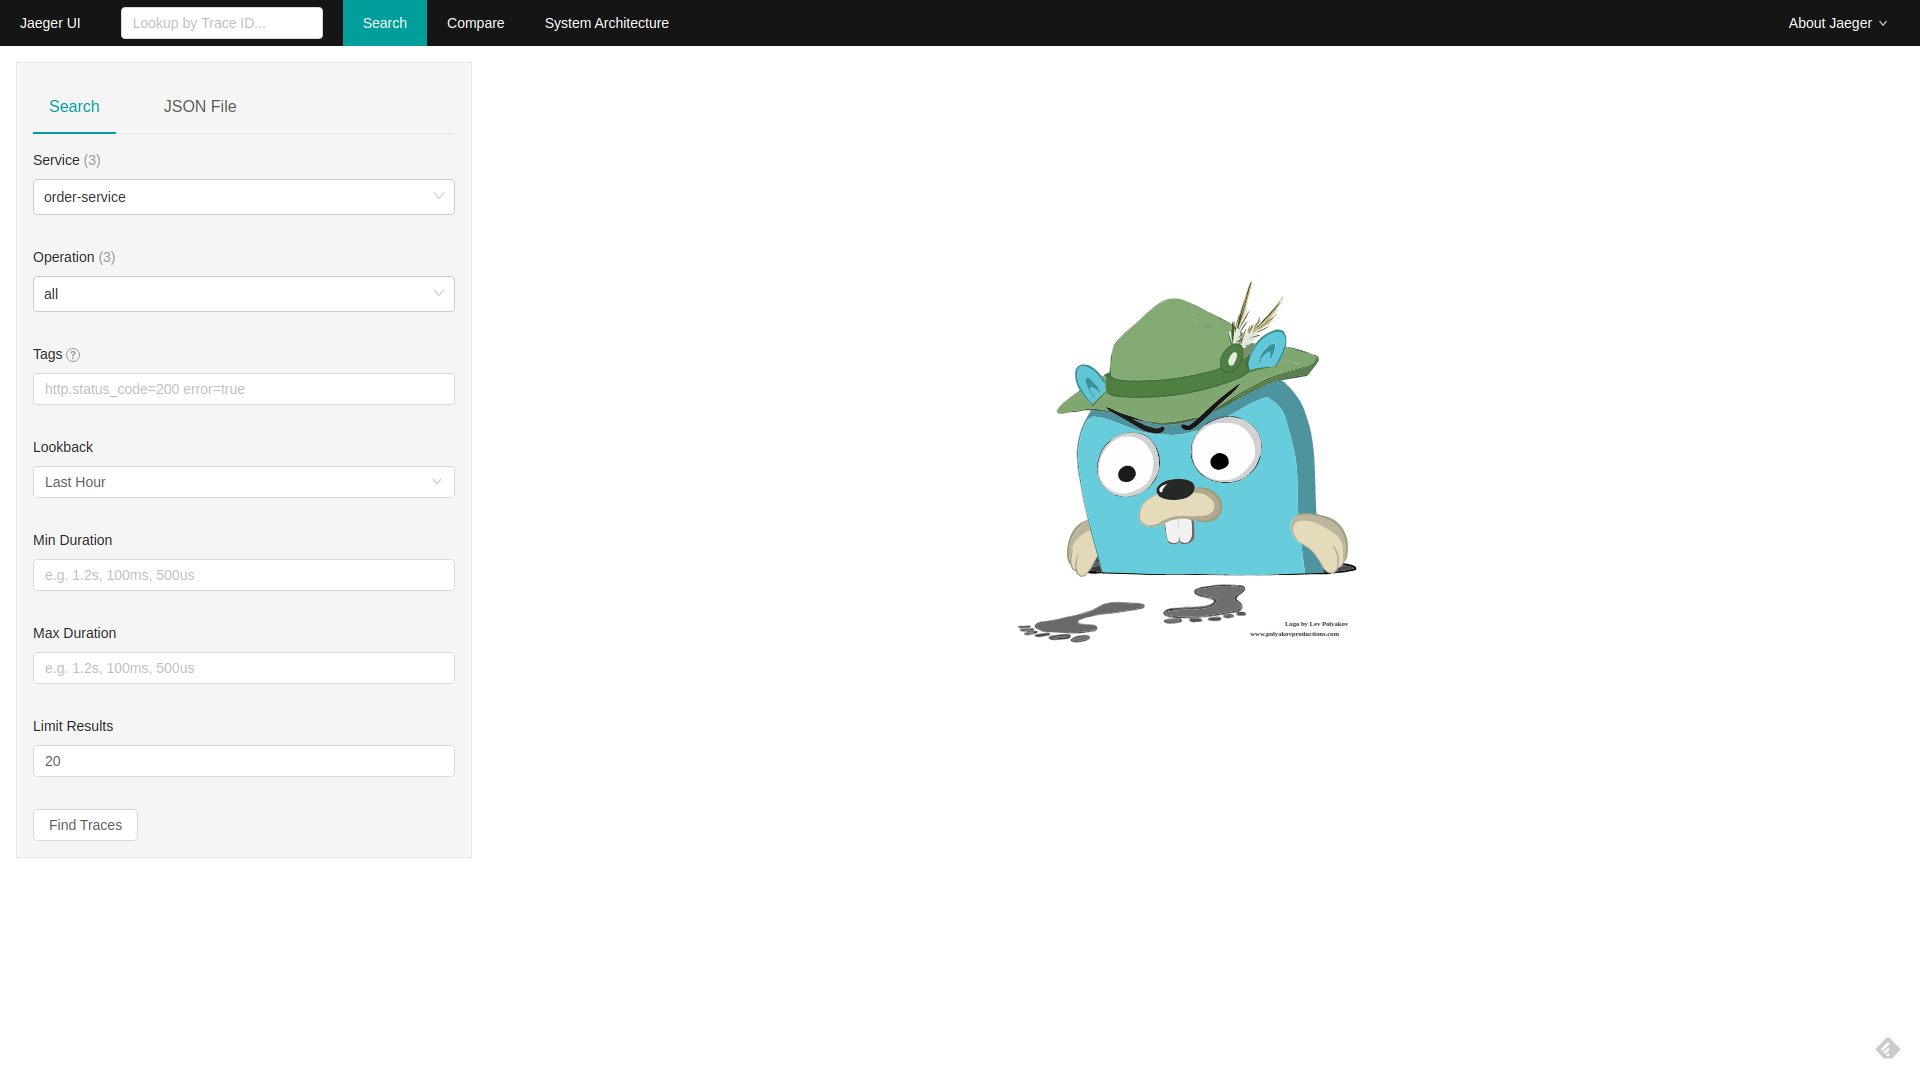
After all the steps above were completed you should see an introduction screen of the Jaeger UI:
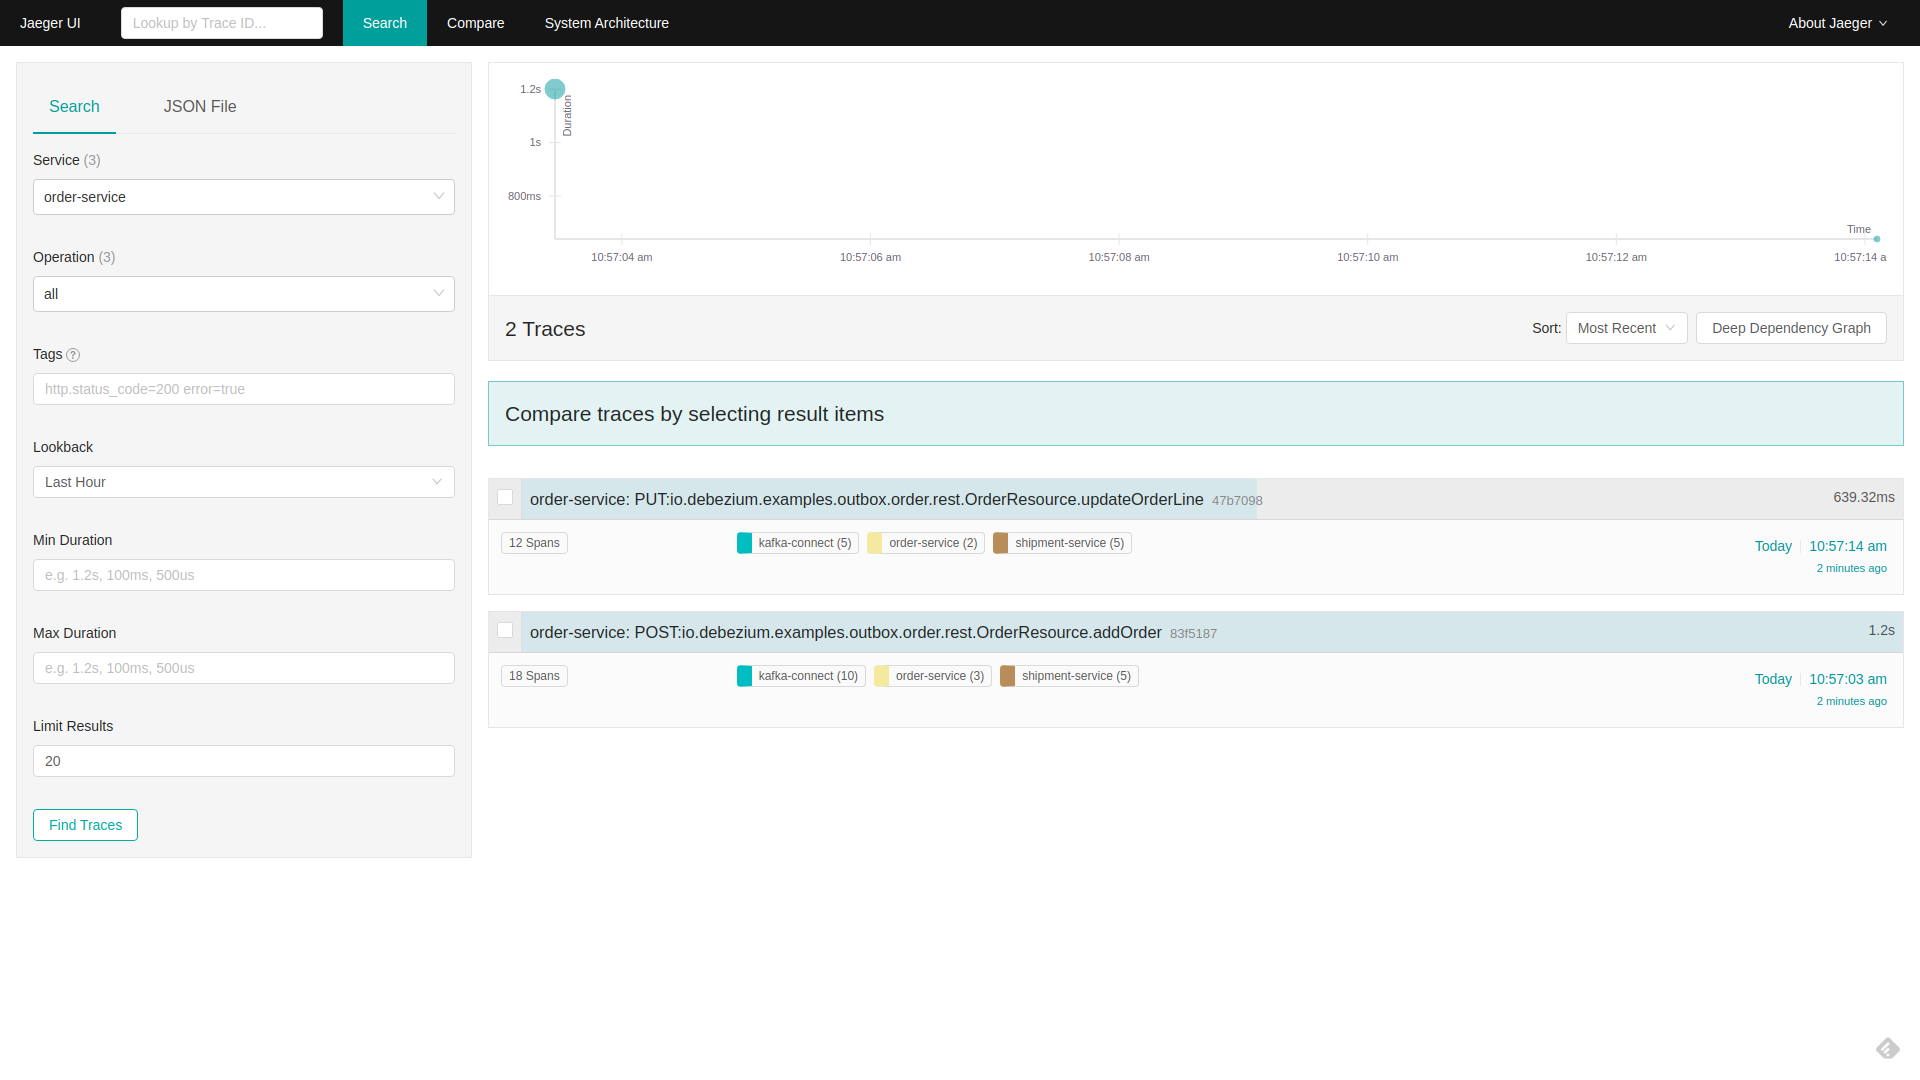
Filter on order-service as a service and click on Find Traces. Two traces should be available:
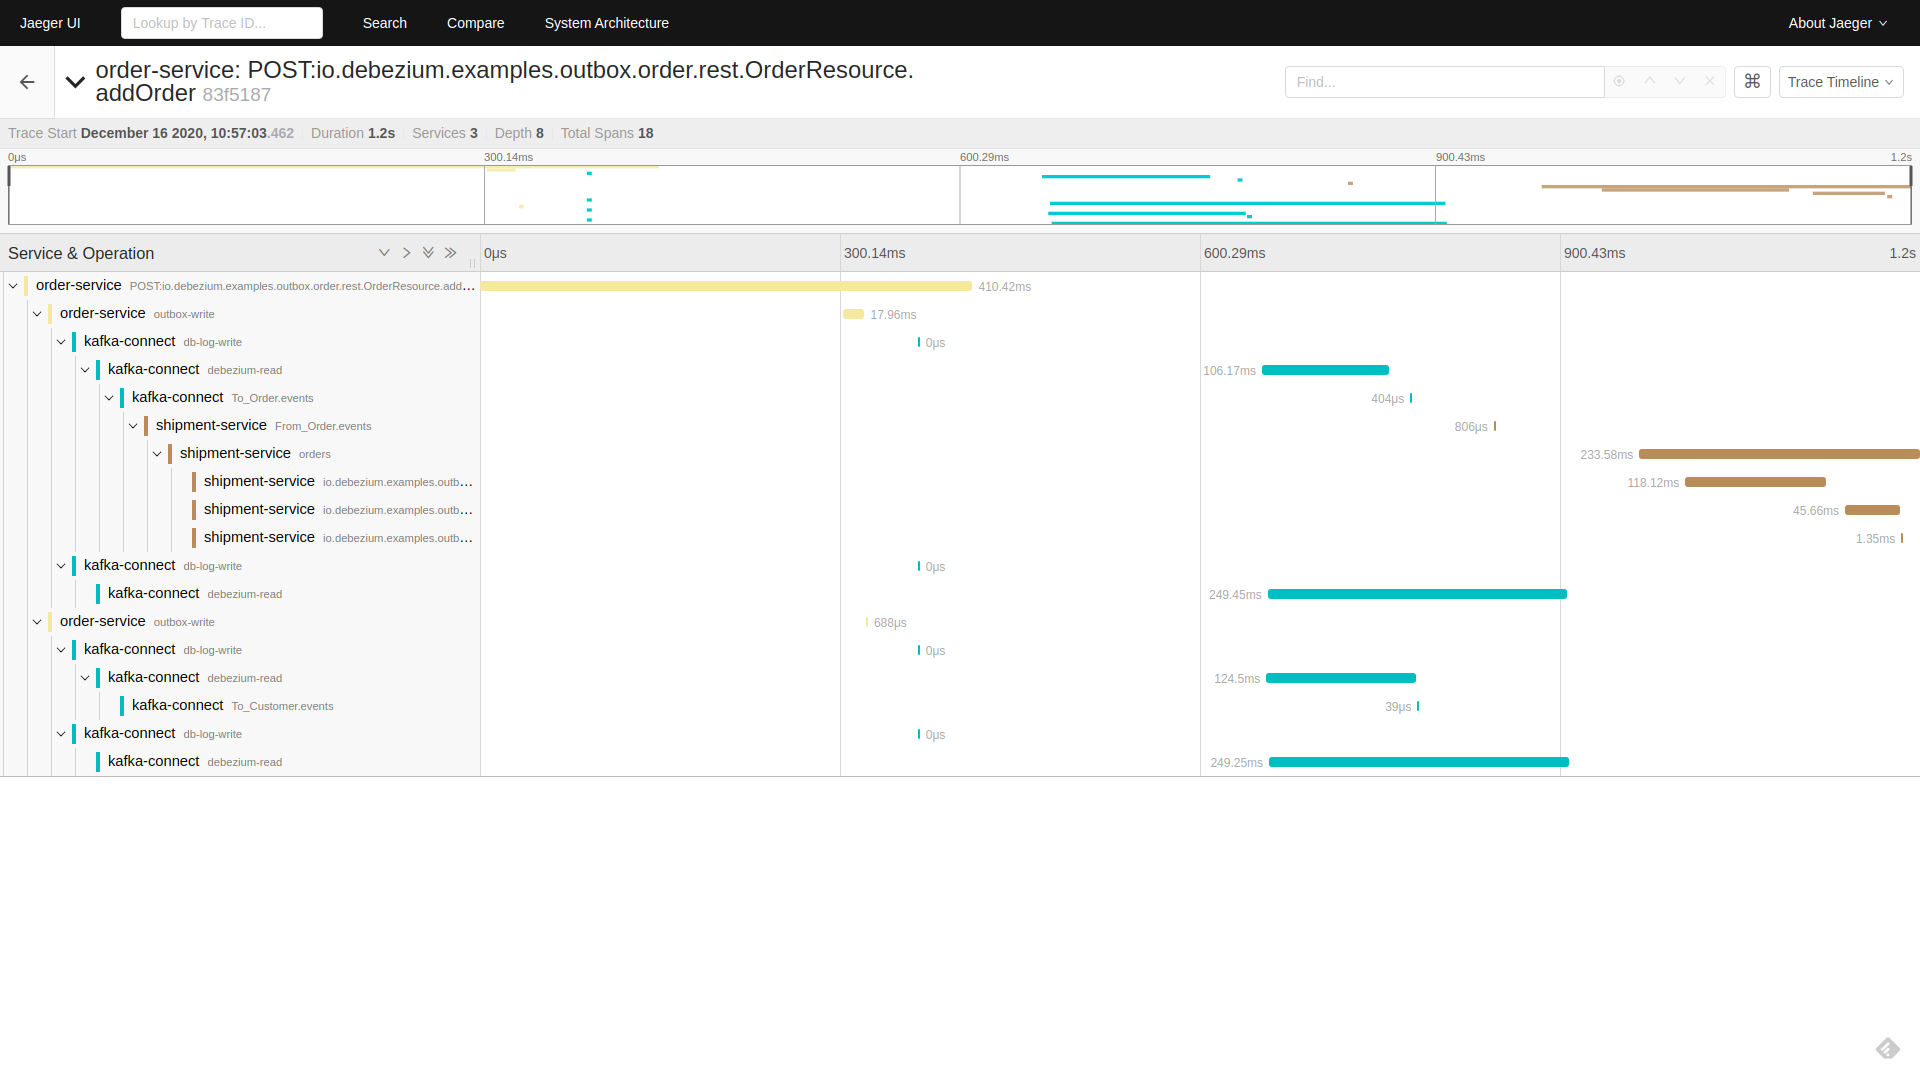
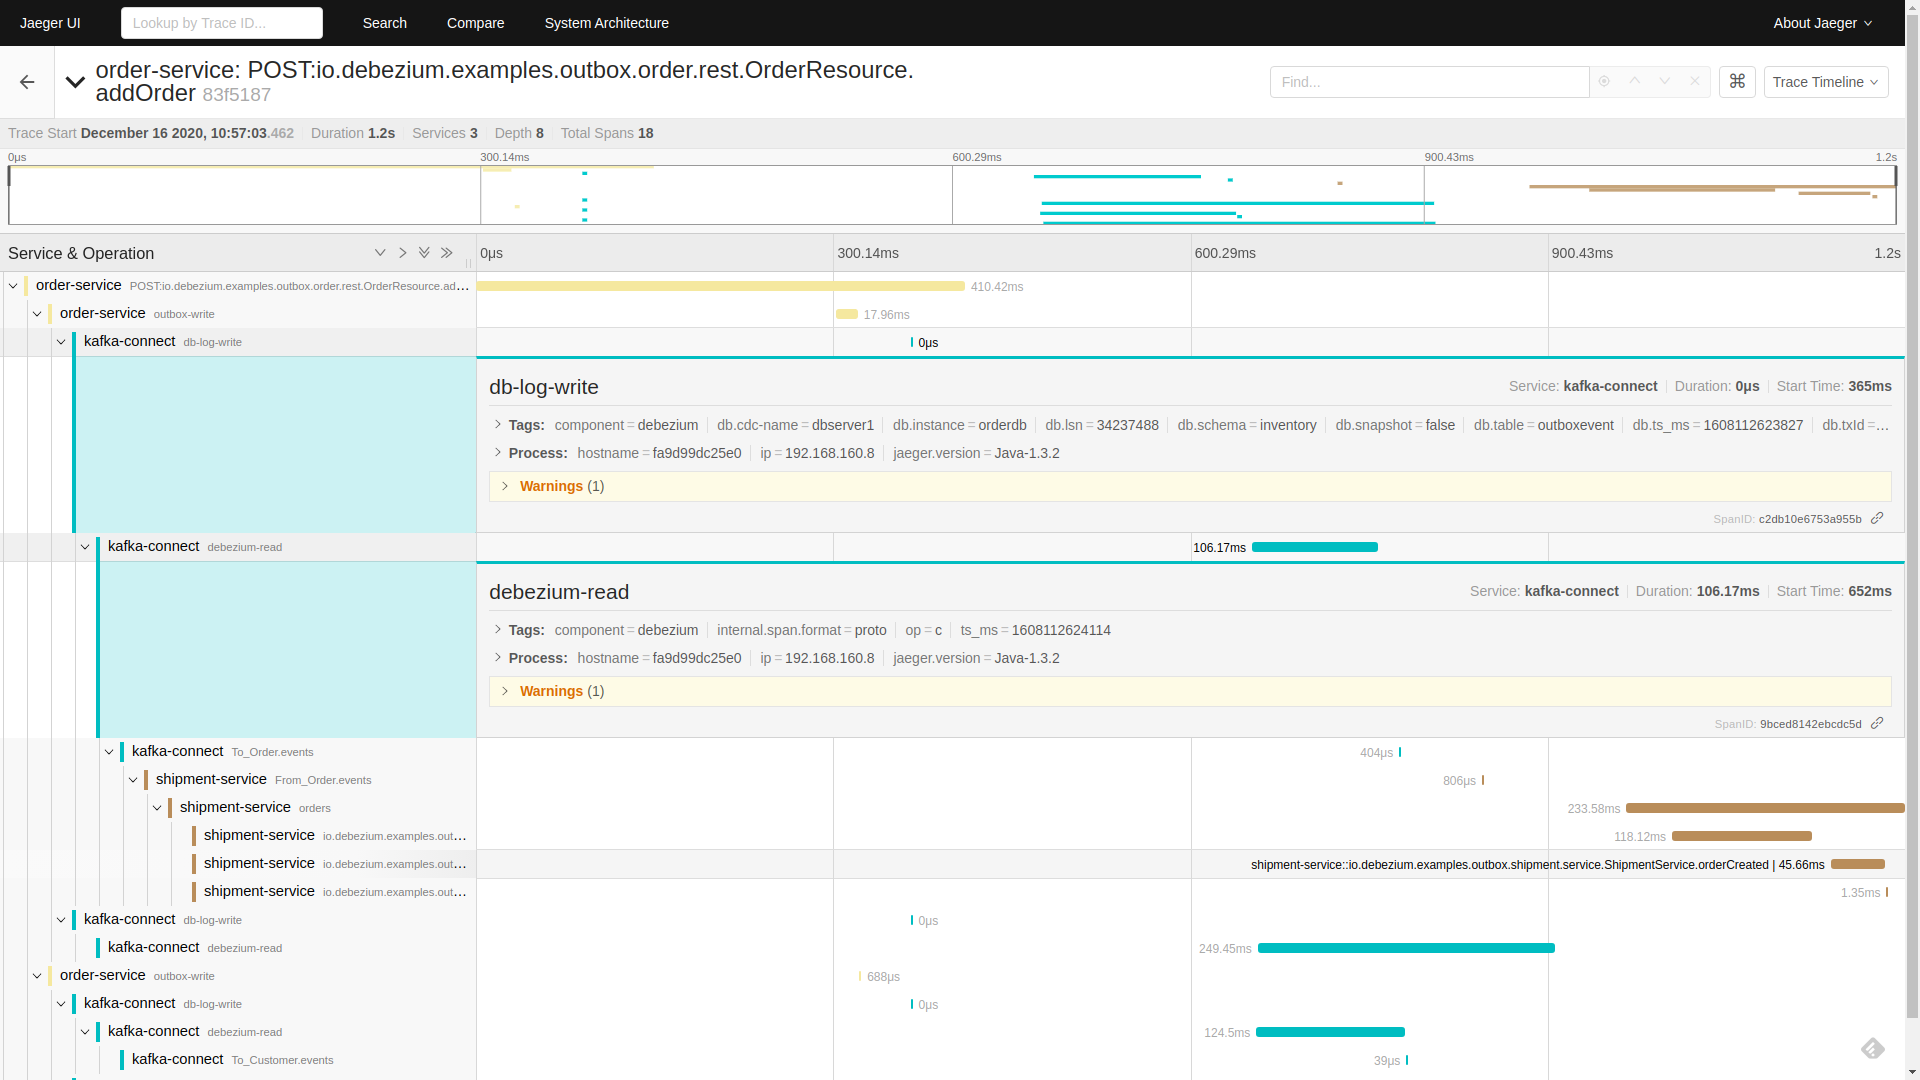
Click on the addOrder service. A tree will open that displays how the initial request incoming via REST API was
-
written to the database by the outbox extension
-
read by Debezium and processed by outbox SMT
-
written to a Kafka topic
-
read from a Kafka topic by
shipment-service -
processed in the different
shipment-servicebusiness methods
Click on the db-log-write and debezium-read spans. The tags of each of them contain extracted Debezium-related metadata like operation or source fields:
Conclusion
In this blogpost, we have discussed what distributed tracing is and why it is beneficial to use it. We have seen how the distributed tracing integration is done at the Debezium level to enable end-to-end tracing and tried a demo application together with Jaeger UI exploration.
While this example was focused on the specific use case of microservices data exchange via the outbox pattern, Debezium integrates with distributed tracing also independently of this particular pattern. By means of the ActivateTracingSpan SMT, Debezium can produce spans representing the time of the change in the source database itself, as well as the time of processing the event by the Debezium connector.
Support for distributed tracing is a new feature in Debezium 1.4 (originally added in Beta1) and will evolve and mature in subsequent releases. Your feedback on this new functionality is highly welcomed!
About Debezium
Debezium is an open source distributed platform that turns your existing databases into event streams, so applications can see and respond almost instantly to each committed row-level change in the databases. Debezium is built on top of Kafka and provides Kafka Connect compatible connectors that monitor specific database management systems. Debezium records the history of data changes in Kafka logs, so your application can be stopped and restarted at any time and can easily consume all of the events it missed while it was not running, ensuring that all events are processed correctly and completely. Debezium is open source under the Apache License, Version 2.0.
Get involved
We hope you find Debezium interesting and useful, and want to give it a try. Follow us on Twitter @debezium, chat with us on Zulip, or join our mailing list to talk with the community. All of the code is open source on GitHub, so build the code locally and help us improve ours existing connectors and add even more connectors. If you find problems or have ideas how we can improve Debezium, please let us know or log an issue.